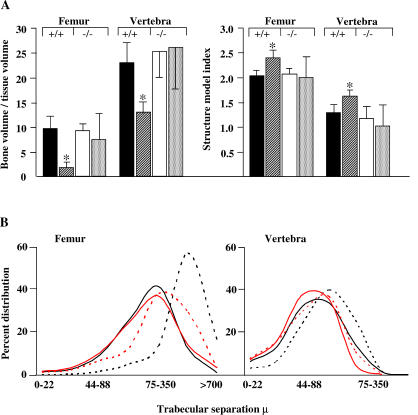
Figure 4. Quantitative Micro-CT of Trabecular Bone Composition and Architecture.
(A) Bone volume/tissue volume (BV/TV) and structure model index (SMI) were calculated on the femur and fourth lumbar vertebra of six or seven mice in each group using 3D Creator software supplied with the Skyscan instrument. Results expressed as the mean ± SD showed significant differences (p < 0.01) between 4-month-old Sam68+/+ mice (solid black) and 12-month-old Sam68+/+ mice (hatched black) but not between 4-month-old Sam68−/− mice (solid white) and 12-month-old Sam68−/− mice (stippled white).
(B) The distance between trabeculae was reflected in a shift to the right of the distribution curves for 12-month-old Sam68+/+. Solid black = 4-month-old Sam68+/+; hatched black = 12-month-old Sam68+/+; solid red = 4-month-old Sam68−/−; stippled red = 12-month-old Sam68−/−. The asterisks denote p < 0.01.

