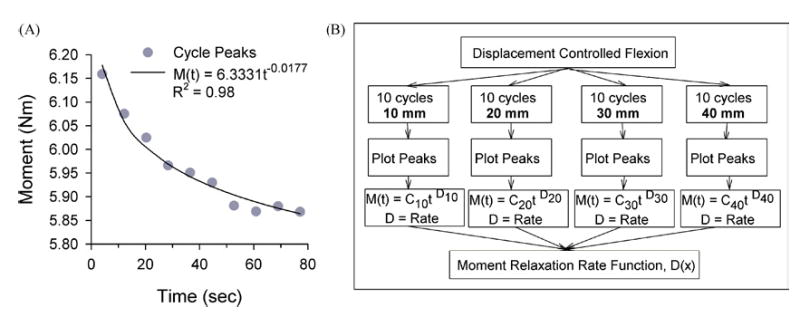
FIGURE 4.

(A) Representative data of the peak moments at L5-S1 during 10 cycles of flexion to 40-mm displacement at T12. Peak moments were regressed with a power fit, M (t) = Ct−D, where the coefficient D is the relaxation rate. (B) Sequence to determine the moment relaxation rate function, D(x) for lumbar spine specimens during displacement controlled flexion. The bending moment-time relationship was plotted and regressed to determine the moment relaxation rate, M(t). The relaxation rates (D) were then plotted as a function of displacement magnitude (x) and regressed to define a Moment Relaxation Rate function, D(x), dependent on peak displacement.
