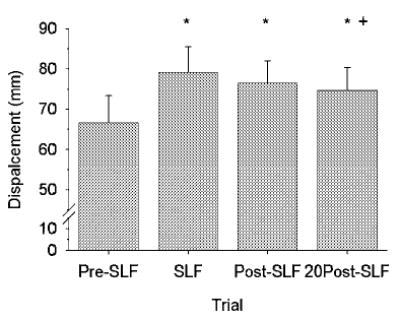
FIGURE 5.

Mean linear displacement of the lumbar specimens (n = 7) at T12 increased during 20 min of static lumbar flexion (SLF), and remained increased during the 10 cycles of flexion immediately following SLF (Post-SLF) and after 20 min of recovery (20Post-SLF). Error bars are standard deviations. * –statistically significant from Pre-SLF displacement, + – statistically significant from SLF (1-Way RM ANOVA with Tukey).
