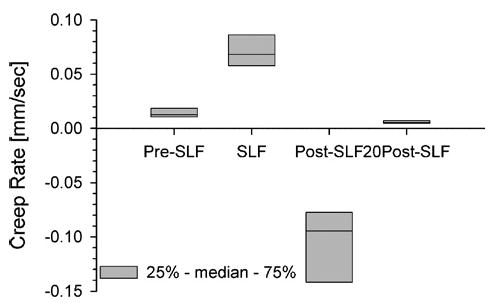
FIGURE 6.

Rate of creep of the lumbar spine while creating a 10-Nm moment at L5-S1. Rate was determined by fitting the peak cyclic displacements – time relationship (Pre-SLF, Post-SLF, 20Post-SLF; see Fig. 3) or continuous displacement-time relationship (SLF) with a power law, Disp(t) = AtB, where (B) is the rate. The rate for Post-SLF was negative indicating that the peak cyclic displacements were decreasing in magnitude. Horizontal line in the box plot indicates median value. All rates were statistically different from one another (Friedman’s test with SNK, p < 0.05).
