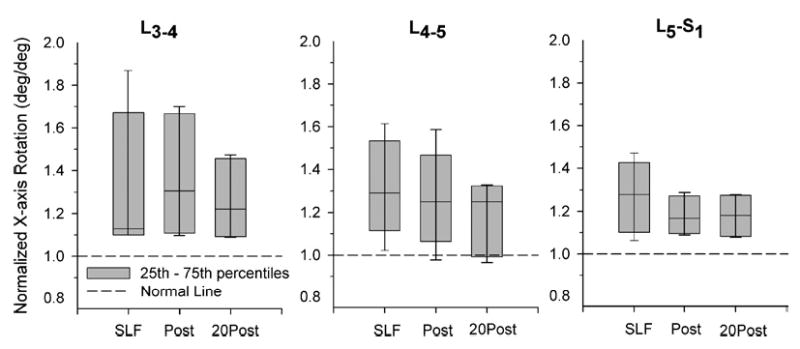
FIGURE 7.

Intervertebral rotations, shown normalized to Pre-SLF magnitudes, about the x-axis (see Fig. 1) were increased during 20 min of static lumbar flexion (SLF), and remained increased during 10 flexion cycles both immediately following SLF (Post) and after a 20-min recovery period (20 Post). Horizontal line in the box plot indicates median value. Bars show the 5th–95th percentiles of the data sets. With the exception of L4-5 Post and 20 Post, the bars do not contain the normalized Pre-SLF data (unity) indicating that the samples are significantly different.
