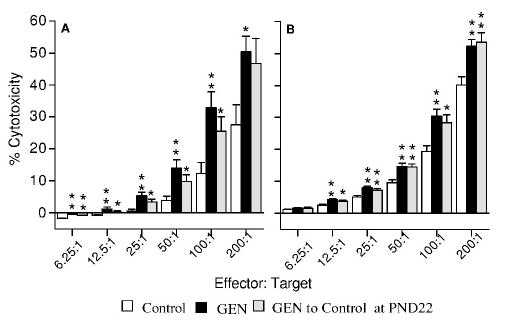
Figure 4.

Effect of genistein (500 μg/g) on IL-2-augmented splenic NK cell activity in F1 mice from the second litters at PND84. (A) Male mice exposed to control diet, GEN-containing diet from GD0 to PND84, or GEN-containing diet from GD0 to PND22 and then shifted to control diet; (B) female mice exposed to control diet, GEN-containing diet from GD0 to PND84, or GEN-containing diet from GD0 to PND22 and then shifted to control diet. Values represent the means ± SE. n = 6–8. Asterisks indicate a difference from the control: *, p ≤ 0.05; **, p ≤ 0.01.
