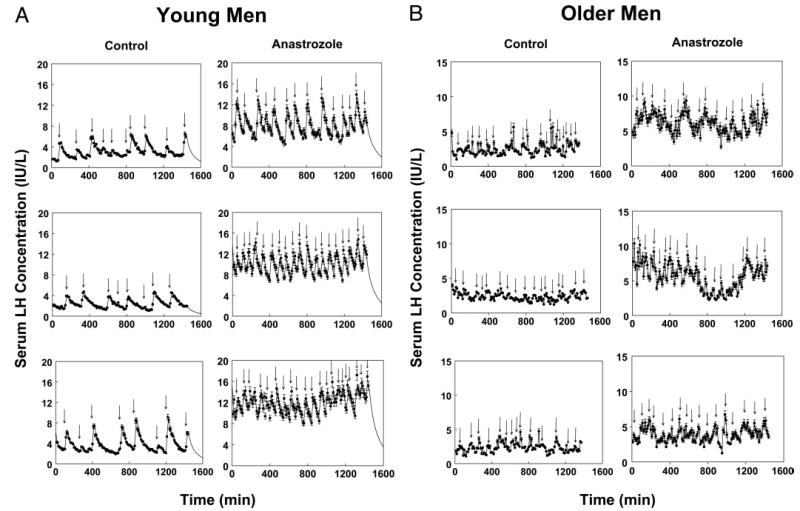
Fig. 1.

Illustrative serum LH concentration profiles in two young and two older men. Subjects underwent blood sampling every 10 min for 24 h on the fifth day of exposure to placebo or anastrozole. LH concentrations were measured via automated, double-monoclonal, LH β-subunit-directed IRMA. Vertical bars associated with each data point denote the within-assay concentration-dependent sd. Arrows mark statistically significant LH pulses detected by model-free Cluster analysis (see Patients and Methods).
