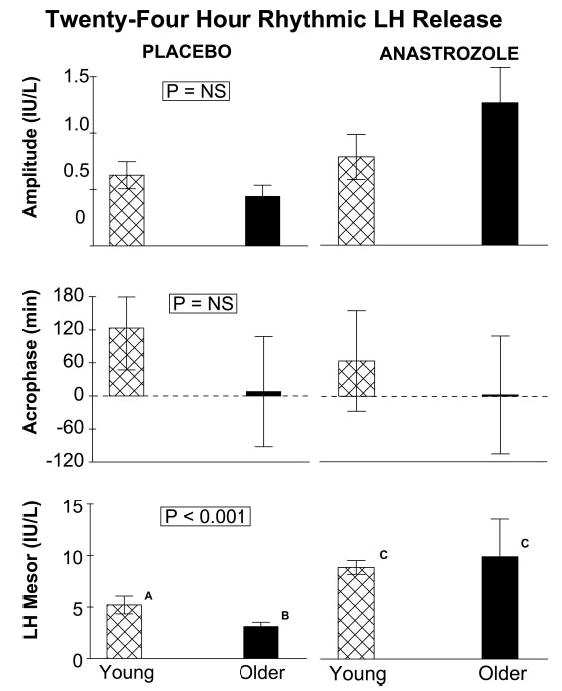
Fig. 6.

Measures of 24-h rhythmicity of LH concentrations. Panels depict (from top to bottom) the cosine amplitude (half the zenith-to-nadir difference), acrophase (clock time of the diurnal maximum), and mesor (daily rhythmic mean). See legend of Fig. 2 for data presentation.
