
Fig. 3.
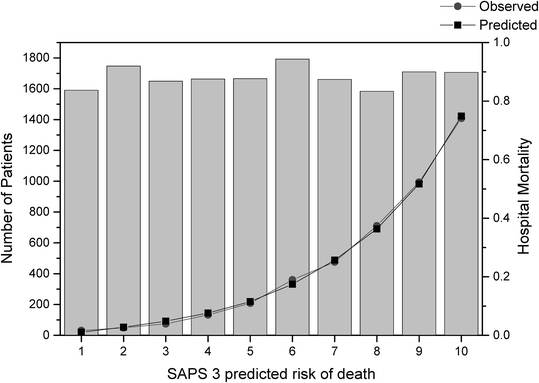
Hosmer-Lemeshow goodness-of-fit test Ĉ in the overall sample. Predicted risk of hospital death, observed hospital mortality rate, and the corresponding number of patients per decile are shown. Columns: Number of patients; squares: mean SAPS 3-predicted mortality per decile; circles: mean observed mortality per decile