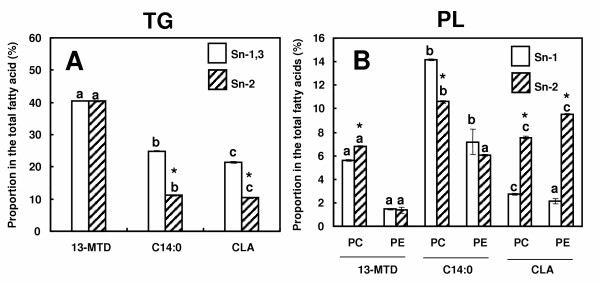
Figure 4.
Positional distribution of 13-MTD in triacylglycerol (A) and phospholipids (B) of SKBR-3 cells. Cells were grown to 80% confluency, and incubated with the fatty acid samples for 6 hours. Phospholipid and triacylglycerol fractions were hydrolyzed respectively with lipase and phospholipase A2, and positional distribution of sample fatty acid was determined as described in the method section. Data are mean ± SE of triplicate analyses. Data not sharing the same letter shows statistically significant difference at p < 0.05 by Tukey-Kramer test. Asterisk shows the statistical significance between position 1,3 and position 2 by Student's t-test.

