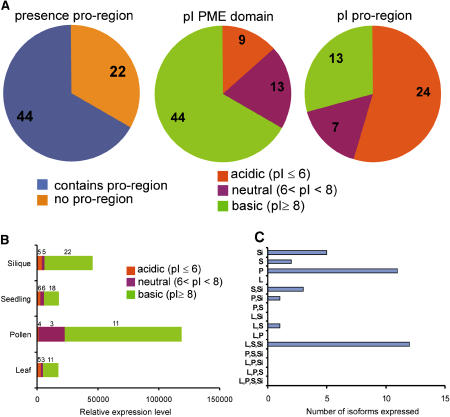
Figure 1.
Analysis of PME Isoforms Encoded in the Arabidopsis Genome.
(A) The number of isoforms with and without a pro-region as well as the number of isoforms of which the pI of the predicted PME domain and pro-region falls within a certain pH interval are depicted.
(B) The total relative expression level of the PME isoforms in a certain organ or cell type. The contribution of acidic, neutral, and basic PME isoforms is depicted. Numbers above the bar segments indicate the number of isoforms that contribute to the expression of the segment. Total PME activity is extremely high in pollen when compared with the other organs/cell types.
(C) Organ and cell-type specificity of PME isoforms. Each isoform was analyzed for its expression in several organs and cell types. The number of isoforms specifically expressed in one organ/cell type or combination of organs/cell types is depicted. Pollen expresses its own specific subset of isoforms. By comparison, other organs/cell types share isoforms as is indicated by the high number of isoforms expressed in leaf, seedling, and silique. Si, silique; S, seedling; P, pollen; L, leaf. Only present calls with expression levels >200 are included in the analysis. Expression data of the PME isoforms are taken from Pina et al. (2005).

