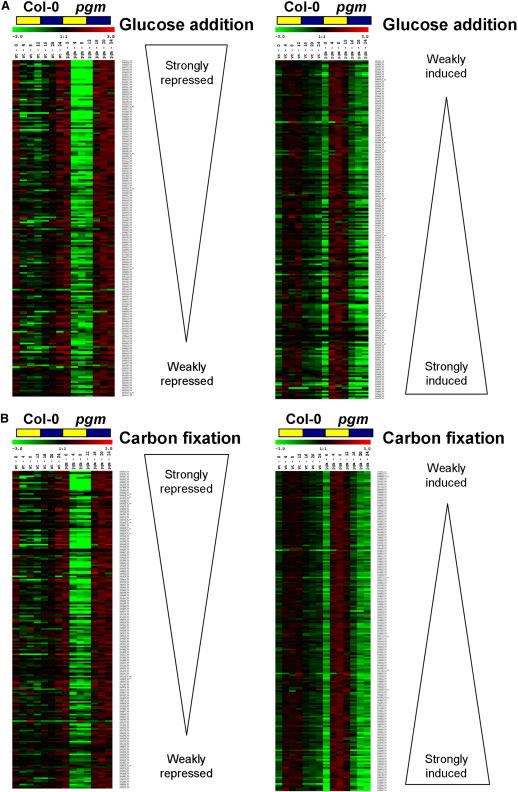
Figure 7.
Quantitative Comparison of the Changes of Expression of Sugar-Responsive Genes during the Diurnal Cycle in Wild-Type Col-0 and in the Starchless pgm Mutant.
The 200 genes that were most strongly repressed (left side) or induced (right side) after adding 100 mM glucose to carbon-starved seedlings were ranked according to the size of the change in expression (A). The same approach was used for carbon fixation–responsive genes (B). The changes in expression at six time points during the diurnal cycle in wild-type Col-0 (left points) and pgm (right points) are shown on a false color scale. For Col-0, each data point is the average of three biological replicates, whereas for pgm, the data points are the average of duplicates at the end of the night and the end of the day and single determinations at the other four time points. These signals were normalized to the average level in the diurnal cycle in the respective genotype.

