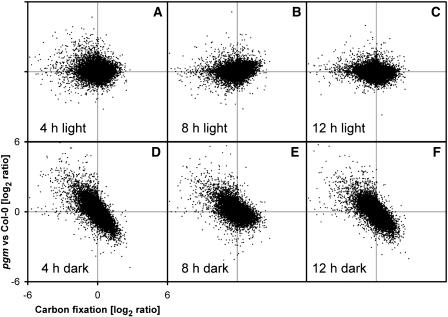
Figure 8.
The Relation between the Changed Levels of Transcripts for Individual Genes in pgm Compared with Col-0 and the Response of These Genes to Glucose.
For each of the 22,746 genes on the ATH1 array, the files (CEL) for Col-0 and pgm were combined and processed with RMA, and the level of each gene in pgm relative to Col-0 was calculated for each of the six harvest times and plotted on the y axis. For each gene, the response to endogenous changes of sugars was extracted from the experiment in which rosettes were illuminated for 4 h at ambient or compensation point [CO2] and plotted on the x axis.

