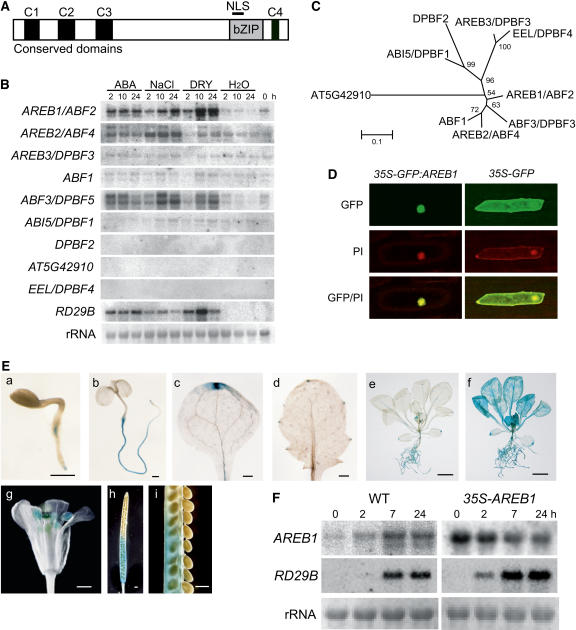
Figure 1.
Expression of the AREB1 Gene and Subcellular Localization of the AREB1 Protein.
(A) Structure of AREB1 family proteins. NLS, nuclear localization signal. C1 to C4 indicate conserved domains within the family.
(B) Expression profiles of AREB family genes in response to dehydration, high salt, or ABA. Each lane was loaded with 20 μg of total RNA from 3-week-old Arabidopsis plants that had been dehydrated (DRY), transferred to hydroponic growth in 250 mM NaCl (NaCl), transferred to hydroponic growth in 100 μM ABA (ABA), or transferred to water (H2O). rRNAs are shown as equal loading controls. A band located in the center of each column indicates a transcript that corresponds to each gene.
(C) Phylogenetic tree of AREB family proteins. Proteins were aligned using ClustalX software, and the tree was constructed using MEGA software.
(D) Nuclear localization of AREB1 protein in onion epidermal cells: fluorescent images of GFP, fluorescent images stained with propidium iodide (PI), and merged images (GFP/PI).
(E) Patterns of AREB1 promoter-driven GUS expression in seedlings at different ages or in different tissues: (a) 2-d-old seedling, (b) 5-d-old seedling, (c) cotyledon, (d) primary leaf, (e) 2-week-old seedling, (f) 2-week-old seedling treated with 50 μM ABA, (g) flower, (h) immature silique, (i) seeds from (h). Bars = 0.5 mm in (a) to (d) and (g) to (i) and 5.0 mm in (e) and (f).
(F) Expression of AREB1 and RD29B in wild-type and 35S-AREB1 plants (line 6) induced by 50 μM ABA treatment. Representative data are shown. Each lane was loaded with 15 μg of total RNA from 2-week-old Arabidopsis plants. rRNAs are shown as equal loading controls.

