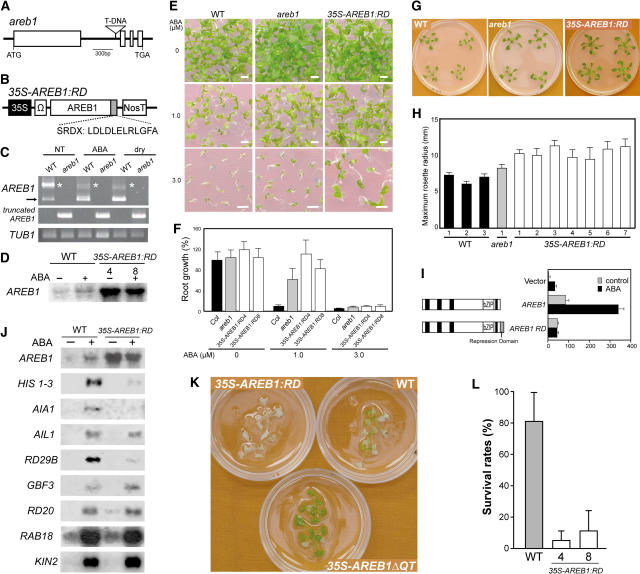
Figure 6.
Analysis of AREB1 Loss-of-Function Mutants.
(A) Scheme of the Arabidopsis AREB1 gene. Exons (open boxes) and introns (lines) are indicated. The position of the T-DNA insertion is shown (not to scale).
(B) Schematic representation of the 35S-AREB1:RD construct used for expression of the chimeric repressor with a modified version of the EAR-motif RD (SRDX), consisting of 12 peptides.
(C) Expression levels of AREB1 in the areb1 knockout mutant were determined by RT-PCR using total RNAs isolated from 2-week-old plants with or without 6-h treatment of 100 μM ABA or dehydration and grown on GM agar plates. Primers for detection of a truncated form of AREB1 mRNA, generated by T-DNA insertion into the first intron of AREB1, have T-DNA– and AREB1-specific binding sequences. The arrow and asterisks indicate expression of AREB1 and a larger band, respectively. TUB1, β-1 tubulin transcript as a control.
(D) RNA gel blot analysis of AREB1 mRNA in wild-type and 35S-AREB1:RD plants (lines 4 and 8) in the absence or presence of 50 μM ABA for 7 h. Eight micrograms of total RNA from 3-week-old seedlings was probed with AREB1 cDNA.
(E) Growth of the mutant areb1 and 35S-AREB1:RD plants (line 4) on GM agar plates containing 0, 1.0, or 3.0 μM ABA, supplemented with 1% sucrose. Seeds were germinated and grown on the medium for 2 weeks. Bars = 25 mm.
(F) ABA dose response of primary root growth. Seeds were geminated and grown on GM plates containing 0.25% Gelrite, 1% sucrose, and various concentrations of ABA. Primary root elongation was measured 19 d after stratification, and relative growth compared with that on ABA-free medium is indicated. Bars indicate standard deviation; n = 15 to 31.
(G) Growth phenotypes of areb1 and 35S-AREB1:RD (line 4) plants that were grown for 3 weeks on GM agar plates supplemented with 1% sucrose.
(H) Maximum rosette radius (i.e., length of the longest rosette leaf) of each plant on a GM agar plate containing 3% sucrose was measured 3 weeks after stratification. Three independent lines of wild-type plants, one line of the areb1 T-DNA insertion mutant, and seven independent lines of 35S-AREB1:RD plants were used. Bars indicate standard deviation; n = 7.
(I) The fusion of the RD to AREB1 creates a repressor. Arabidopsis protoplasts were cotransfected with the RD29B-GUS reporter and the effector construct expressing AREB1 or AREB1:RD, or vector DNA. The RD29B-GUS reporter plasmid and the transient assay system are described in the legend of Figure 2.
(J) Expression profile of downstream genes identified by microarray analysis (Table 1) in 35S-AREB1:RD plants (line 4). Two-week-old seedlings were either not treated (−) or treated (+) with ABA for 7 h. Each lane contained 7 μg of total RNA. Three to eight independent lines were used; results from one representative experiment are shown.
(K) Difference in recovery after rehydration among 35S-AREB1ΔQT (line 12), 35S-AREB1:RD (line 4), and wild-type plants. Transgenic and wild-type plants were grown on GM agar plates for 2 weeks, transferred to Petri dishes, left unwatered for 4 h, and then rewatered. The photograph was taken 2 d after rewatering.
(L) Quantification of the survival rates of the wild-type and 35S-AREB1:RD plants (lines 4 and 8) after rehydration. Water was withheld for 5 h from 3-week-old plants and then survival rates were counted. Surviving plants were scored on the second day. Survival rates and standard deviations were calculated from the results of four independent experiments (n = 10 each). Bars indicate standard deviations.

