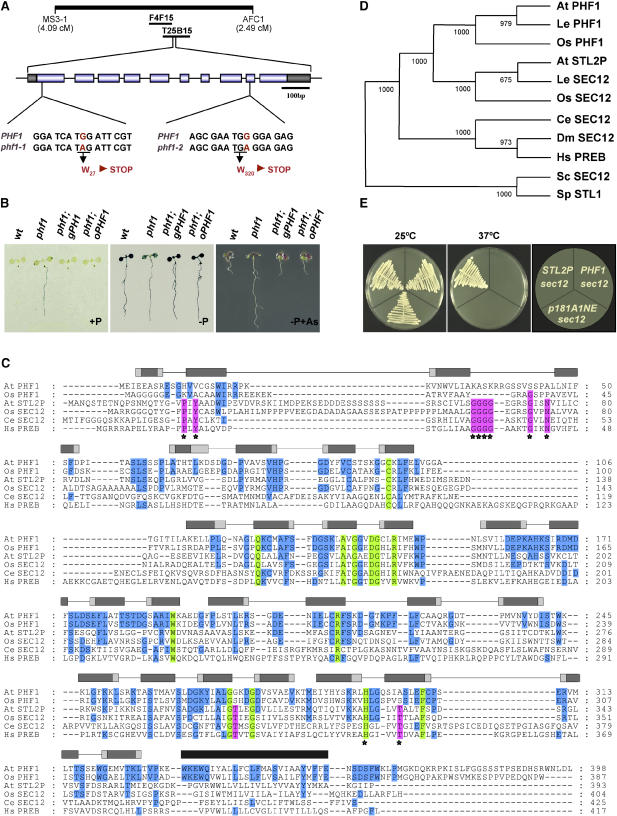
Figure 3.
Positional Cloning of PHF1 and the Characteristics of Its Protein.
(A) Scheme of the position of PHF1 on chromosome 3 of Arabidopsis, between markers MS3-1 and AFC1. The exon structure of PHF1 is represented with boxes (dark, untranslated; light, coding region). The sequence surrounding the mutations (G-to-A transitions) in phf1-1 and phf1-2 is also shown.
(B) Complementation of phf1. Histochemical analysis of IPS1:GUS activity in plants grown in Pi-rich (left) or Pi-deficient (middle) medium, and phenotype of plants grown in the presence of 10 ppm arsenate (right). The genetic constitution of the plants is as follows: wild type; phf1-1 (phf1); and phf1-1 transformed with a 6-kb genomic region corresponding to the PHF1 gene (phf1; gPHF1) or with the coding region under the control of the promoter of the 35S gene of Cauliflower mosaic virus (phf1; oPHF1).
(C) Alignment of Arabidopsis PHF1 with presumed functional PHF1 homologs and with SEC12 proteins using the program T-COFFEE (Notredame et al., 2000), structural predictions using the GENESILICO metaserver (Kurowski and Bujnicki, 2003), and the SMART program (Letunic et al., 2004). The seven predicted WD repeats are indicated by gray boxes representing the predicted β-strands within each single WD (arranged in a D-to-C configuration). The dark areas in each box represent core regions predicted by the two secondary prediction methods in GENESILICO; light areas represent regions predicted by only one of the methods. The predicted transmembrane domain is indicated by a black rectangle. Colored in green are amino acid residues conserved in all PHF1 and SEC12 proteins from plants or animals used in (D); only a subset of the sequences are shown. Blue indicates amino acid residues conserved in all PHF1 proteins; pink indicates amino acid residues conserved in all plant and animal SEC12 proteins. Asterisks highlight amino acid residues conserved in all SEC12 proteins.
(D) Phylogram of PHF1 and SEC12 proteins constructed with the PHYLIP software (Felsenstein, 1989). The bootstrapping value (out of 1000 samples) for each node, obtained with the same software, is shown. The proteins are as follows: AtPHF1 (Arabidopsis PHF1); LePHF1 (Lycopersicon esculentum); OsPHF1 (Oryza sativa); AtSTL2P (Arabidopsis SEC12 ortholog); OsSEC12 (O. sativa); CeSEC12 (Caenorhabditis elegans); DmSEC12 (Drosophila melanogaster); HsPREB (Homo sapiens); ScSEC12 (Saccharomyces cerevisiae); SpSTL1 (Schizosaccharomyces pombe).
(E) Complementation tests with the temperature-sensitive sec12 mutant from S. cerevisiae sec12 mutant cells transformed with empty vector (p181A1NE) or with vector expressing the STL2P open reading frame or PHF1 open reading frame grown at 25 and 37°C for 3 d.

