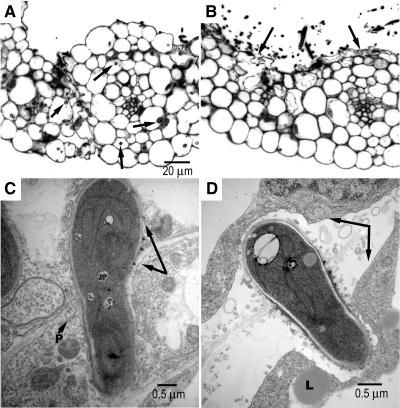
Figure 7.
Δgas 1 Mutants Fail to Establish a Normal Host–Parasite Interface.
(A) Section of a young maize leave 40 h after inoculation with a mixture of haploid wild-type cells (FB1 and FB2) visualized by light microscopy. Numerous invading hyphae can be detected (arrows) but the host cells or tissue organization seems undisturbed.
(B) Section of a young maize leave 40 h after inoculation with a mixture of haploid Δgas1 mutant cells (HBU13 and HBU14) visualized by light microscopy. Most hyphal profiles can be observed on the leaf surface. Some epidermal cells are collapsed (arrows). The bar in (A) is for (A) and (B).
(C) Invading dikaryotic hypha of a wild-type cross (FB1 and FB2) as visualized by transmission electron microscopy. The fungal hypha is in close contact with the plant cells. Arrows point to the plasma membranes of host cells, which delimit a characteristic interaction zone (asterisks) in close contact with the fungal wall. In the host wall, plasmodesmata (P) can be seen.
(D) Invading dikaryotic hypha of a Δgas1 mutant cross (HBU13 and HBU14) as visualized by transmission electron microscopy. The fungal hypha itself does not differ greatly in appearance from the wild-type filament seen in (C). However, there is a notable difference with respect to the host–fungus interface. The fungal filament is separated from the host plasma membrane by a large space (arrows) containing small vesicles. Host lipid deposits (L) can be observed in the vicinity of invading mutant hyphae. The fungus–plant interaction zone (asterisks) seems intact.

