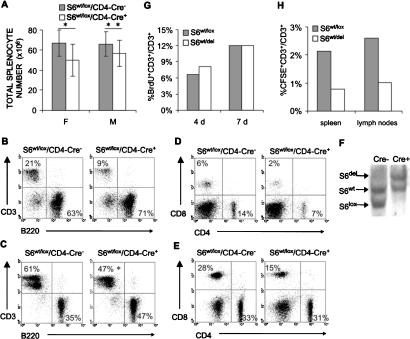
Figure 2.
Decreased number of S6wt/del T cells in the spleen and lymph nodes is a consequence of their decreased survival. (A) Total cell number in spleens from female (F) and male (M) S6wt/lox/CD4-Cre- and S6wt/lox/CD4-Cre+ mice (n = 10, for each group). Error bars represent standard deviation. For females, (*) p < 0.05 versus S6wt/lox/CD4-Cre- splenocytes; and for males, (**) p > 0.05 versus S6wt/lox/CD4-Cre- splenocytes (Mann Whitney U-test). (B,D) FACS analysis of cells from S6wt/lox/CD4-Cre- and S6wt/lox/CD4-Cre+ spleens. (C,E) FACS analysis of cells from S6wt/lox/CD4-Cre- and S6wt/lox/CD4-Cre+ lymph nodes (n = 35, for each group). (*) p < 0.001 versus S6wt/lox/CD4-Cre- CD3+ cells (t-test). Genotypes are as indicated above the panels. Cell surface markers are shown as coordinates. The numbers in quadrants refer to percentage of respective cell population of live cells. (F) Southern blot analysis of genomic DNA from S6wt/lox/CD4-Cre- and S6wt/lox/CD4-Cre+ T cells purified from lymph nodes of 8-wk-old mice using the S6 intron-specific probe. (G) Six-week-old S6wt/lox/CD4-Cre- and S6wt/lox/CD4-Cre+ mice were daily injected intraperitoneally with 100 μg/g of body weight 5-BrdU (Sigma) in 200 μL of PBS during the indicated time periods; 5-BrdU incorporation into DNA was determined by flow cytometry. The percentages of 5-BrdU-positive lymph node T cells are shown. The experiment is a representative of four independent experiments. (H) CFSE-labeled S6wt/lox/CD4-Cre+ or S6wt/lox/CD4-Cre+ T cells (10 × 106) were transferred into wild-type recipients by intravenous injection, and the percentage of CFSE-labeled T cells was determined in spleens. The total number of T cells in different recipients was similar. The experiment is a representative of three independent experiments.

