Figure 1.

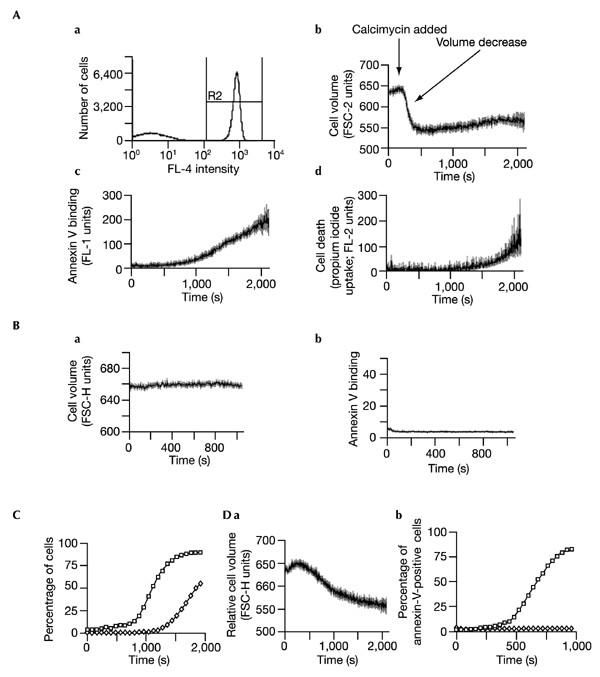
Kinetics of calcium-induced apoptosis. After establishing baselines in the continuous presence of annexin-V–FITC and PtdSer, apoptosis was induced with calcimycin. (A) a, Flow-cytometric gating of cells staining positive with allophycocyanin-conjugated anti-CD4 (R2) in the absence of physical cell separation. R1 (not shown) was used to exclude cell debris. a–d, Changes in cell volume, PtdSer translocation and cell death, monitored simultaneously in the CD4+ lymphocyte population following induction with 1 μM calcimycin. For each parameter, data as a function of time after induction of apoptosis are indicated as a derived line graph (mean units ± s.e.m.). b, Change in cell volume (measured by FSC-H) as a function of time, indicating cell shrinkage. c, Changes in PtdSer exposure at the cell surface, indicated by annexin-V–FITC binding. d, Cell death (membrane permeability) as indicated by propidium iodide uptake. (B) Representative control plots indicating (a) the stability of cell size and (b) annexin-V binding, in the absence of calcimycin stimulation. Variation in responses to calcimycin within any given set of experiments was low. In this experiment, over 17 min there was a fall in control FSC-H of 0.8 units and an increase in the percentage of CD4+ cells binding annexin V from 3% to 3.3%. By contrast, in four experiments on the same day, stimulation with 0.5 μM calcimycin resulted in a fall of FSC-H from 656.7 ± 0.2 to 614.8 ± 2.6 units (mean ± s.d.) and a rise in annexin-V-binding cells from 3% to 72.3 ± 13% (mean ± s.d.). (C) Percentage of CD4+ cells having translocated PtdSer (annexin-V-positive cells, indicated by open squares) or died (propidium iodide-positive cells, indicated by open diamonds), obtained by replotting the data from panels (A) b–d. The background population of cells binding annexin V or taking up propidium iodide before stimulation was excluded from the derived line graphs and from (C). (D) Response to stimulation with low dose calcimycin. Cells were stimulated with 0.2 μM calcimycin. a, Shrinkage of CD4+ cells, indicated by change in FSC-H (mean ± s.e.m.) as a function of time. b, Translocation as a function of time, indicated by the percentage of annexin-V-positive cells (open diamonds). A comparison with increase in percentage of CD4+ cells translocating in response to 0.5 μM calcimycin (open squares) is shown.
