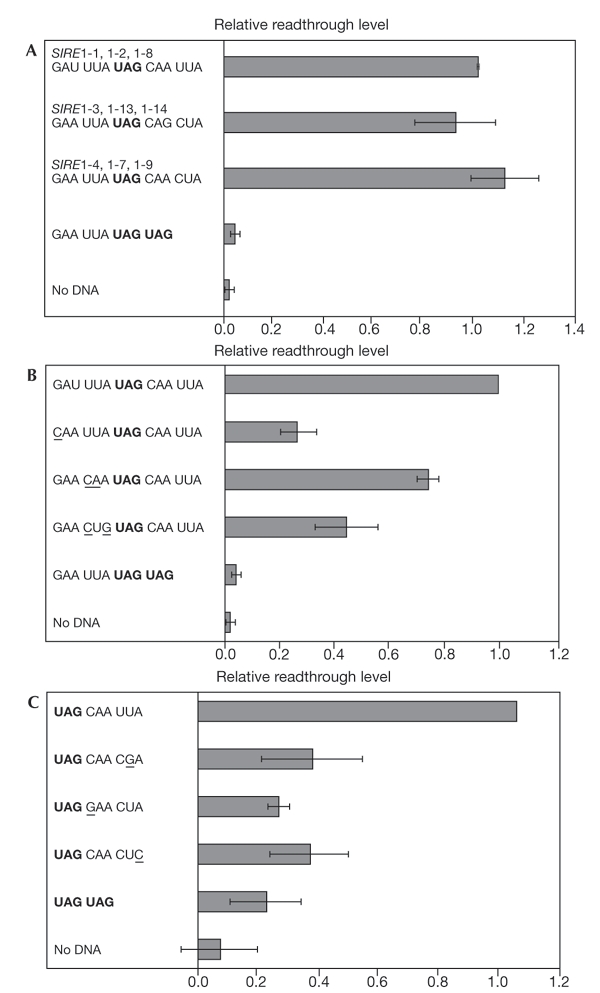
Figure 2.

Translational readthrough of SIRE1. For these experiments, levels of readthrough are relative to the initial readthrough level of the CAAUUA SIRE1 variant. UAG stop codons are in bold. Mutations in the SIRE1 sequences are underlined. Error bars represent one standard deviation above and below the average. (A) The three SIRE1 sequence variations result in the same level of readthrough, averaging 5% of the normal activity of a β-glucuronidase reporter gene (data not shown). (B) Readthrough levels of clones with mutations in sequences upstream of the stop codon. (C) Readthrough levels of clones with mutations in the CARYYA consensus. R, any purine. Y, any pyrimidine.
