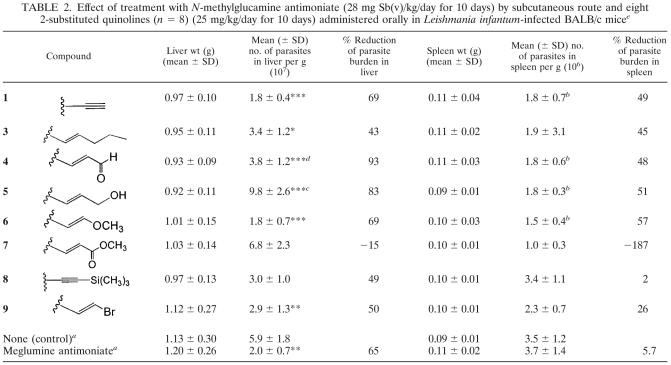
TABLE 2.
Effect of treatment with N-methylglucamine antimoniate (28 mg Sb(v)/kg/day for 10 days) by subcutaneous route and eight 2-substituted quinolines (n = 8) (25 mg/kg/day for 10 days) administered orally in Leishmania infantum-infected BALB/c micee
n = 18.
Statistically significant (P < 0.05) compared with meglumine antimoniate-treated mice.
Statistically significant (P < 0.001) compared with meglumine antimoniate-treated mice.
Statistically significant (P < 0.0001) compared with meglumine antimoniate-treated mice.
Statistical significance compared to untreated mice is indicated as follows: *, P < 0.05; **, P < 0.001; ***, P < 0.0001.

