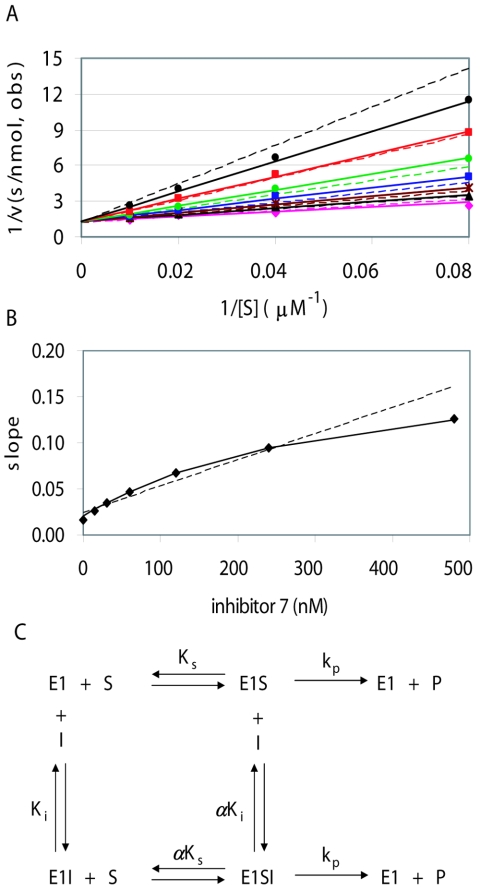
FIG. 1.
Kinetic mechanism of compound 7. (A) Lineweaver-Burke double reciprocal plots for initial velocity data using 10 nM HPV6 E1 and 12.5 to 100 μM ATP. Data points correspond to observed initial velocities for inhibitor concentrations of 480 nM (black triangles), 240 nM (red squares), 120 nM (green circles), 60 nM (blue squares), 30 nM (brown asterisks), and 15 nM (black circles), as well as those observed (obs) without inhibitor (magenta diamonds). Corresponding lines were determined by nonlinear regression using the full data set to the equations for linear competitive or hyperbolic competitive inhibition (dotted or solid lines, respectively). The kinetic parameters obtained for compound 7 from the hyperbolic competitive fit are given in Table 2 (first of the two experiments). (B) Slope replot. For each inhibitor concentration in panel A, the slope of the 1/v versus 1/[S] plot was determined by linear regression, and these slopes are plotted versus inhibitor concentration (diamonds). Lines are plotted for the predicted slopes after fitting to the linear or hyperbolic competitive mechanisms (dotted or solid lines in both panels A and B). The solid line corresponds closely to the experimentally determined slopes. (C) Scheme for the hyperbolic competitive mechanism (29). The parameter α indicates the degree to which inhibitor binding affects substrate binding, or vice versa. Values of α greater than 1 indicate that binding of one ligand weakens binding of the other. As α approaches infinity, the lower line becomes insignificant and the mechanism becomes indistinguishable from linear competitive inhibition. For a relatively slow enzyme such as E1, it is expected but not rigorously proven that the value of Km is approximately equal to the substrate dissociation constant Ks and the value of kcat is approximately equal to the rate constant for conversion of bound substrate to product, kp.

