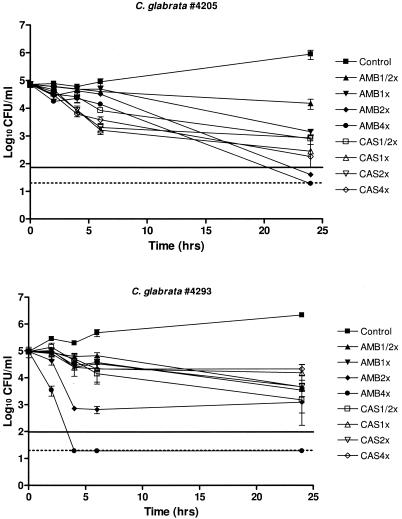
FIG. 2.
Time-kill studies conducted with C. glabrata 4205 and C. glabrata 4293. The solid lines represent a >99.9% growth reduction compared with the initial inoculum size (fungicidal effect). The limit of detection (20 CFU/ml) is represented by the dotted lines. Each data point represents the mean ± standard deviation for three independent experiments.

