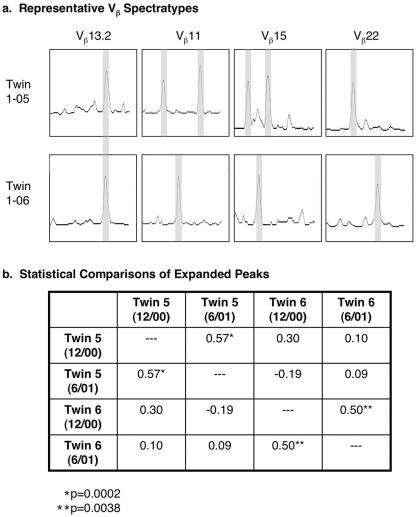
FIG. 3.
T-cell receptor Vβ spectratype analysis of CD8+ T lymphocytes. TCR Vβ distributions were assessed and compared. (a) Spectratyping was performed using CD8+ T lymphocytes from both twins from 12/00. Representative profiles are shown for four Vβ families. Of the numerous expanded peaks deviating from Gaussian distribution, a few were common to both twins (e.g., Vβ13.2), but most were discordant (e.g., Vβ11, Vβ15, and Vβ22). (b) Spectratyping was performed on CD8+ lymphocytes from the twins in 12/00 and 6/01. Spearman correlation coefficients of expanded peaks in intra- and intertwin comparisons are given. Identical analyses of eight unrelated HIV-1-seropositive control subjects (28 interindividual comparisons) revealed a mean correlation coefficient of 0.28 ± 0.19 (data not shown).

