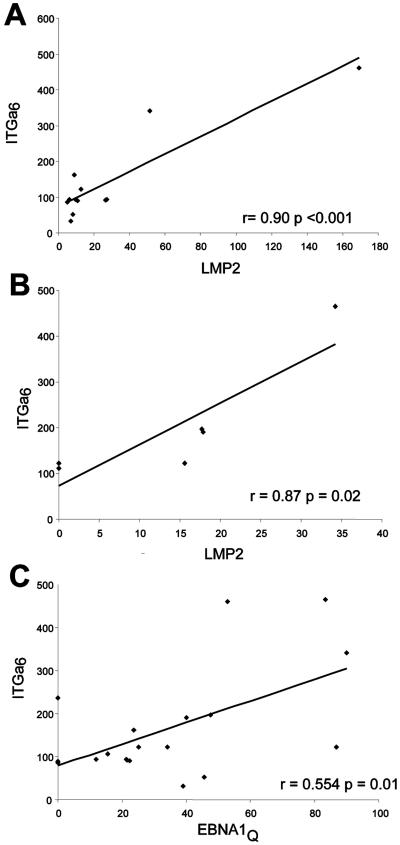
FIG. 2.
ITGα6 expression is strongly associated with LMP2A expression in NPCs. (A) LMP2A mRNA expression levels were plotted against ITGα6 mRNA expression levels, determined by qRT-PCR, for the 14 NPC samples used for the neighborhood analysis shown in Fig. 1 (see Materials and Methods). The Pearson correlation coefficient and P value are represented in the plot. (B) As described for panel A but with six independent NPC biopsy samples. (C) ITGα6 transcript levels were plotted against EBNA1(Q-K) mRNA expression levels. The association is significant but weaker compared to LMP2A results.

