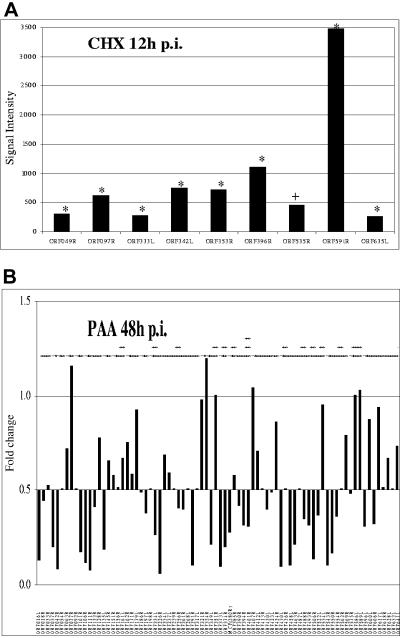
FIG. 2.
Immediate-early, early, and late transcripts of RSIV. (A) Immediate-early transcripts of RSIV. HINAE cells were treated with CHX (50 μg/ml) 1 h prior to and throughout the RSIV infection and total RNA was isolated at 12 h p.i. The RSIV CHX-untreated and CHX-treated samples were labeled with Cy5 and Cy3-dUTP, respectively, and hybridized to the microarrays. RSIV IE transcripts were observed under CHX treatment. The signal intensity is calculated as the mean intensity of duplicate spots of each viral ORF minus the background signal. Statistical significance of changes in expression was assessed by paired t test (+, P > 0.05; *, P < 0.05) (B) Early and late transcripts of RSIV. HINAE cells were treated with PAA (100 μg/ml) 1 h prior to and throughout the RSIV infection and total RNA was isolated at 48 h p.i. The RSIV PAA-treated and RSIV-infected samples were labeled with Cy5- and Cy3-dUTP, respectively, and hybridized to the microarrays. The downward bars represent L genes whose expression levels were inhibited at least twofold (signal intensity ratios less than 0.5) by PAA treatment, while the upward bars represent E genes that were unaffected by PAA. The signal intensity ratio is calculated from the signal intensity of RSIV PAA-treated samples divided by the RSIV-infected samples. The experiment was performed in duplicate. The statistical significance of changes in expression was assessed by paired t test (+, P > 0.05; *, P < 0.05; **, P < 0.001; ***, P < 0.0001).

