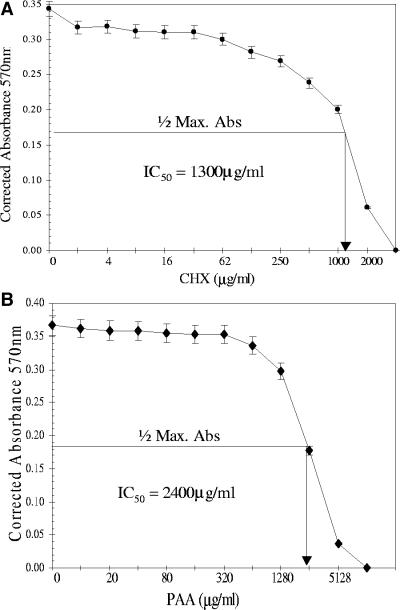
FIG. 5.
IC50 detection of CHX and PAA. The assays were performed with HINAE cells following the CellTiter 96 nonradioactive cell proliferation assay kit's protocol. IC50 values were determined by locating the drug treatment value corresponding to one-half the maximum absorbance (Max. Abs.) value. The y axis represents corrected absorbance values at 570 nm that were subtracted from the absorbance value of the positive control (100% lysed cells). The x axis represents concentrations of drug inhibitors on a log scale to plot against the corrected absorbance values. The concentrations were twofold dilutions, and each concentration was tested in quadruplicate. The assay of each drug was performed in duplicate. (A) IC50 detection of CHX. (B) IC50 detection of PAA.

