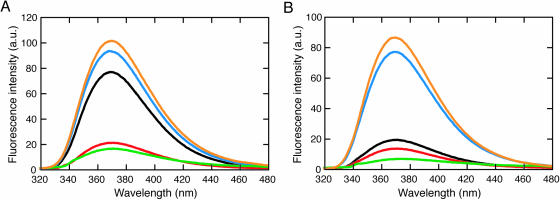
Figure 5.
Fluorescence emission spectra of the duplexes containing 2-amino purine adjacent to two cytosines (A) or two guanines (B), opposite A (red), T (green) or X (blue) in a duplex, in addition to a duplex forming a 2-amino purine bulge (orange) and the single-stranded DNA (black). All measurements were carried out in the 1 M NaCl-phosphate buffer at 4°C.

