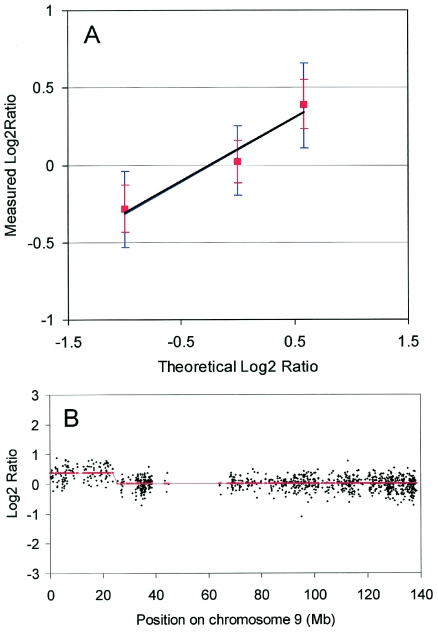
Figure 2.
Performance of the oligo array CGH platform. (A) DNA from the cell line GM01750 was hybridized against normal female reference DNA. Copy number changes were detected using the smoothing algorithm (14). Blue: median values and SDs (error bars) were calculated for the areas with different copy numbers and are displayed as a function of the theoretical log2ratio. The different areas were the X-chromosome (theoretical ratio = 1/2, log2ratio = −1), chromosomes 1–8, 10–13 and 15–22 (theoretical ratio = 2/2, log2ratio = 0) and the gain in chromosome 9 (theoretical ratio = 3/2, log2ratio = 0.58). The correlation coefficient is 0.98 and the slope is 0.38. Red: same values calculated after applying a moving average of 3 to the data. Note that the red error bars do not overlap. (B) Detailed profile of chromosome 9 of the GM01750 hybridization. Log2ratios were calculated without moving average and are displayed in black as a function of their position on chromosome 9. Smoothed values of the log2ratios (red).

