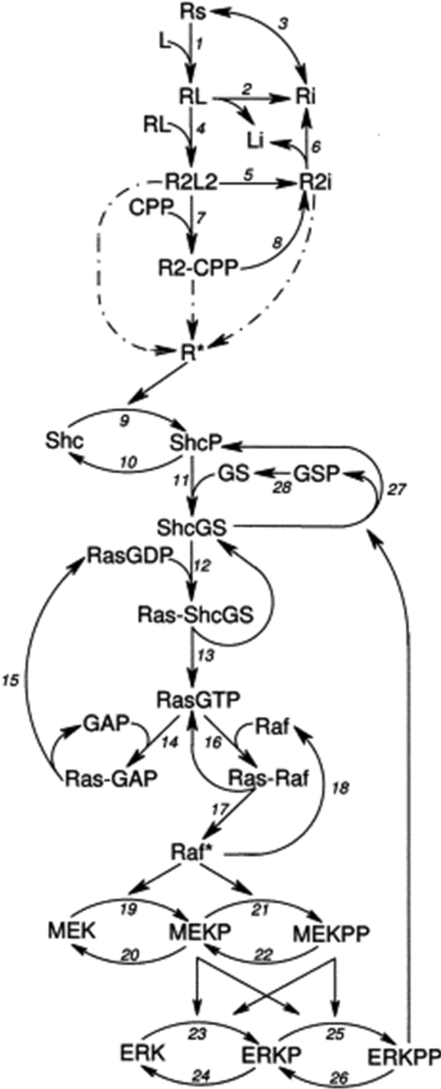
Figure 7. Brightman and Fell [35] model diagram.
This schematic representation of the Brightman and Fell model of EGF signal transduction is taken from Figure 1 of [35]. Reprinted by permission of the Federation of European Biochemical Societies. © 2000. In this schema, GS represents the Grb2–SOS complex.

