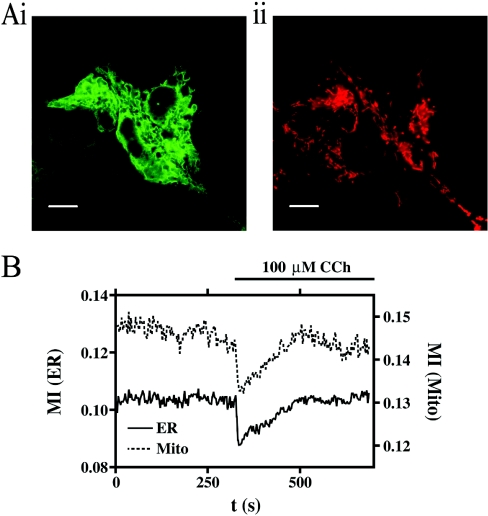
Figure 1. The effects of 100 μM carbachol (CCh) on organelle mobility.
(A) HEK-293 cells stably expressing GFP targeted to the ER (i) and loaded with Mitotracker Red (ii) illustrate the respective organelle morphology and distribution. Scale bar represents a distance of 10 μm. (B) The change in organelle mobility, described here as the MI, following the addition of CCh for both the ER (continuous line) and mitochondria (Mito; broken line). See Supplementary Movie 1 (http://www.BiochemJ.org/bj/392/bj3920291add.htm for a full version of this Figure.

