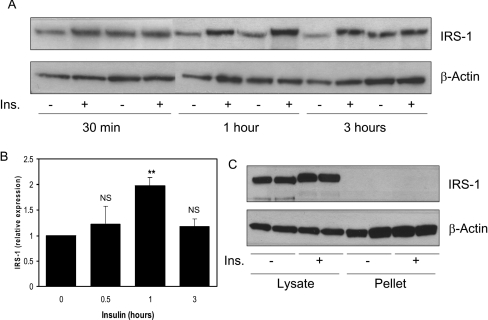
Figure 4. Induction of IRS1 protein by insulin in hepatoma cells.
H4IIE cells were serum-starved overnight and then treated with or without 10 nM insulin for the indicated times. (A) Western blot analysis was performed on 15 μg of cell lysates to assess the IRS1 and β-actin protein expression. (B) Blots were quantified by densitometry. Values are the ratio of IRS1 to β-actin expressed relative to serum-starved cells and are the average±S.E.M. of three experiments performed in duplicate. **P<0.01 (0 compared with 1 h); NS, not significant; Ins., insulin. (C) IRS1 and β-actin expression was visualized in the Triton-X-100-insoluble fraction and directly compared with the levels in the soluble fraction (an equivalent amount of each fraction was loaded, and the blot overexposed).

