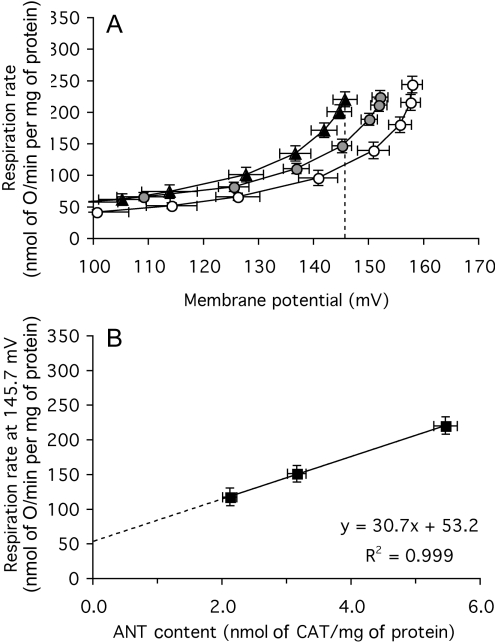
Figure 6. Proton leak of mitochondria from Drosophila expressing different amounts of ANT.
(A) Dependence of proton-leak rate (measured as the respiration rate driving proton leak in the presence of oligomycin) on membrane potential in mitochondria from ANT-overexpressers (▲), wild-type ( ) and ANT-underexpressers (○). The broken line indicates the highest common potential (145.7 mV). (B) Relationship between proton-leak rate at the highest common potential [measured as the respiration rate driving proton leak at 145.7 mV in (A)] and ANT content (from Figure 4B). Replicate measurements were performed on each preparation and averaged. Values are means±S.E.M. from 26 (ANT-overexpressers and wild-type) or 23 (ANT-underexpressers) independent preparations. For the interpolated values of respiration (in B), the error shown is the weighted mean of the respiration-rate errors of the flanking experimental points in (A).

