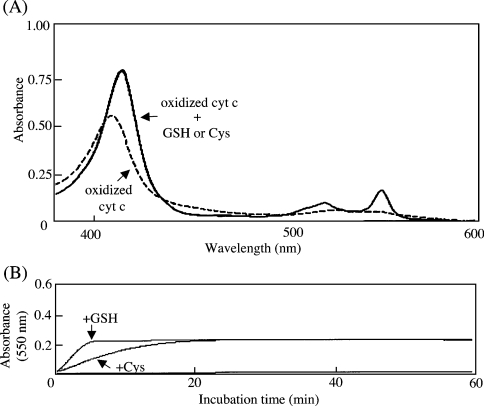
Figure 2. Effects of GSH and cysteine on redox state of cyt c.
(A) After incubation of oxidized cyt c with 1 mM DTT, GSH or cysteine for 1 h at 37 °C, spectral changes between 370 and 600 nm were measured. The dotted line shows the spectrum of oxidized cyt c in the absence of a reductant; the solid line shows superimposed spectra of oxidized cyt c treated with GSH or cysteine. (B) Absorbance at 550 nm of oxidized cyt c was continuously recorded in the presence of 1 mM GSH or cysteine for 1 h. The spectra corresponded to oxidized cyt c (9 μM) that was incubated with GSH (top trace), cysteine (middle trace) or no reductant (bottom trace).

