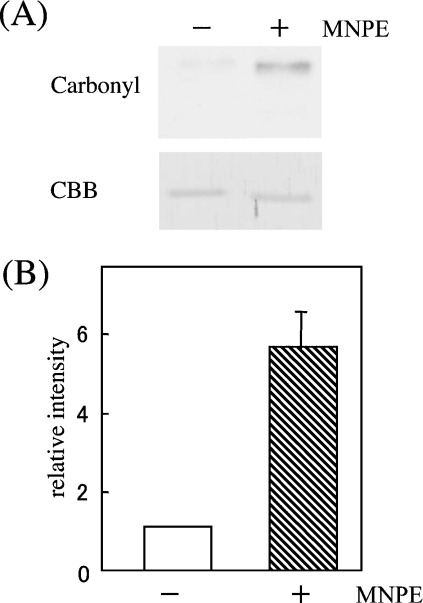
Figure 9. Elevated carbonyl contents in singlet oxygen-treated cyt c.
(A) Carbonyl contents of oxidized cyt c (100 ng) that were treated with or without 1 mM MNPE for 1 h at 37 °C were assessed by an Oxyblot kit. Protein staining by Coomassie Brilliant Blue (CBB) was performed to show equal protein loading. (B) Quantification of the band intensity was performed for five assays by densitometric scanning of X-ray films. Data represent the mean values±S.D. relative to the control sample (without MNPE treatment).

