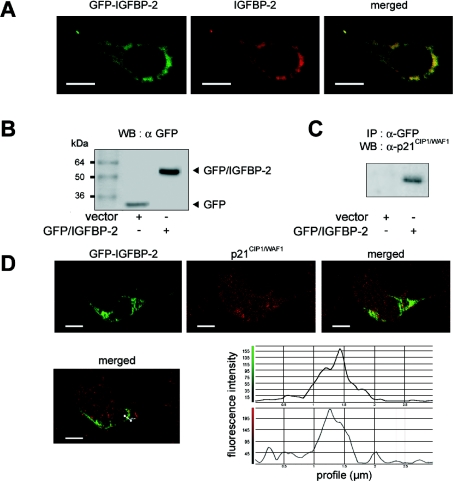
Figure 4. Specific interaction between IGFBP-2 and p21CIP1/WAF1 detected by transfection of GFP–IGFBP-2 fusion protein.
Sub-confluent MLE-12 cells were transiently transfected with either the empty vector (pEGFP-C3, noted as vector), or the GFP–IGFBP-2 vector (pEGFP-C3-IGFBP-2), and subsequently cultured for 24 h in the presence of serum. (A) Dual visualization of GFP–IGFBP-2 fusion protein. Images of fixed cells were taken 24 h post-transfection with pEGFP-C3-IGFBP-2 and show the GFP fluorescence (left panel), and red immunostaining with anti-IGFBP-2 antibody followed by rhodamine-anti-(goat IgG) secondary antibody (middle panel), together with the merged image (right panel). Scale bars represent 10 μm. (B) Expression of GFP and GFP–IGFBP-2 fusion protein in transfected MLE-12 cells. Equal amounts of total protein extracts from transfected cells were analysed by Western blotting (WB) with monoclonal anti-GFP antibody. GFP protein and GFP–IGFBP-2 fusion protein were detected at the expected sizes of 27 kDa and 62 kDa respectively. (C) Coimmunoprecipitation of GFP–IGFBP-2 with endogenous p21CIP1/WAF1. Total protein extracts from MLE-12 cells transfected with the indicated plasmid were immunoprecipitated (IP) with anti-GFP antibody and p21CIP1/WAF1 was detected with anti-p21CIP1/WAF1 antibody in the precipitated complex on a Western blot as described in the Experimental section. A representative blot from three independent experiments is shown. (D) Colocalization of GFP–IGFBP-2 fusion protein and endogenous p21CIP1/WAF1 in transfected MLE-12 cells. Images of fixed cells were taken 24 h post-transfection with pEGFP-C3-IGFBP-2 and show the GFP fluorescence (left panel), the red immunostaining with anti-p21CIP1/WAF1 antibody, which had been labelled with Alexa Fluor™ 555 fluorescent dye (middle panel), together with the merged image (right panel). The profiles of the pixel intensity of the green and red channels along the white line drawn in the merged image show the colocalization of GFP–IGFBP-2 and p21CIP1/WAF1. Scale bars represent 10 μm.

