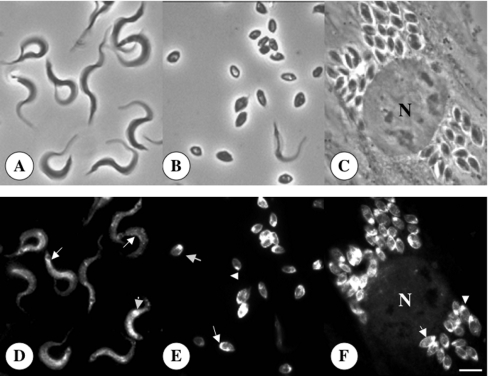
Figure 2. Immunofluorescence microscopy showing the localization of TcHAs in trypomastigote (D) and amastigote (E, F) forms of T. cruzi.
Upper panels show the same cells as in lower panels by bright field microscopy. N, host cell nucleus. Scale bar, 4 μm (A–F). Labelling of the plasma membrane (arrows) and intracellular structures (arrowheads) is evident in both trypomastigotes and amastigotes.

