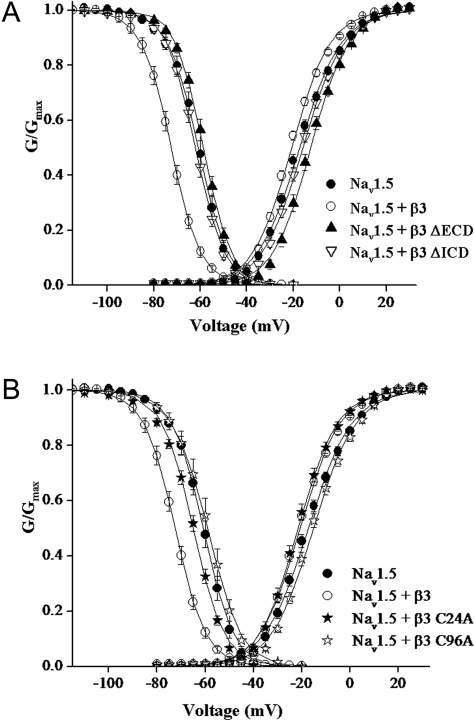
Figure 5. Steady-state inactivation and activation plots.
(A) ●, Nav1.5; ○, Nav1.5 + β3; ▲, Nav1.5 + β3ΔECD; and ▽, Nav1.5 + β3ΔICD. (B) ●, Nav1.5; ○, Nav1.5 + β3; ★, Nav1.5 + β3 C24A; and ☆, Nav1.5 + β3 C96A. Voltage dependence of activation was determined with a 20 ms voltage pulse from −80 to +60 mV in steps of 5 mV from a holding potential of −120 mV. Steady-state activation was derived from eqn (1). Steady-state inactivation was determined using a two-pulse method, from a holding potential of −120 mV and test potentials between −130 and −20 mV for 1 s followed by a test pulse to +10 mV. The data points show means±S.E.M. for 13–27 cells. The solid line represents the average of each Boltzmann function fit to the individual data curves. The steady-state parameters are shown in Table 1.

