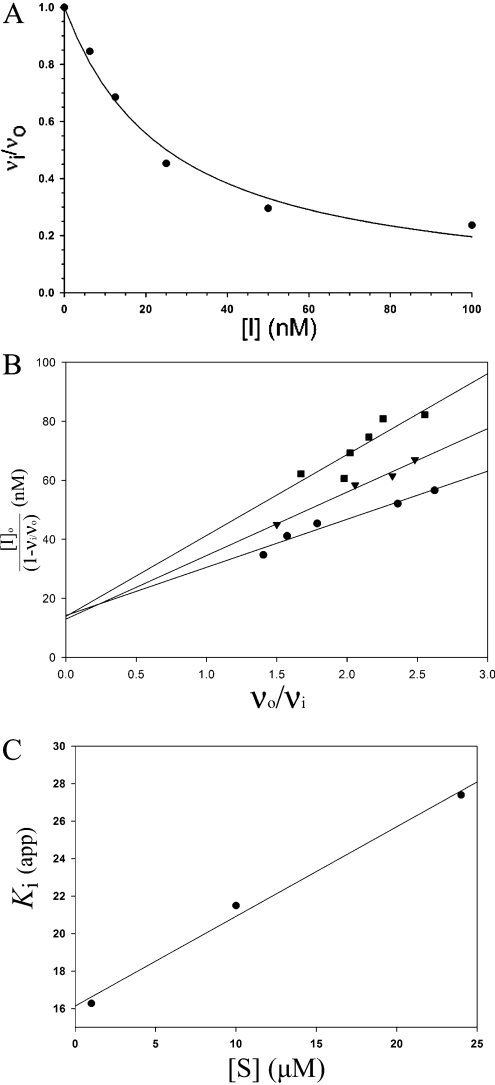
Figure 1. Competitive inhibition mechanism.
(A) A typical inhibition curve fitted with the Morrison equation (eqn 1) is shown for MAG-182. (B) The inhibition assay was also performed with substrate concentrations of 1, 10 and 24 μM and plotted according to the Henderson equation (eqn 3), described in the text. (C) A linear increase in the slope, Ki (app), is indicative of competitive inhibition, according to eqn (2).

