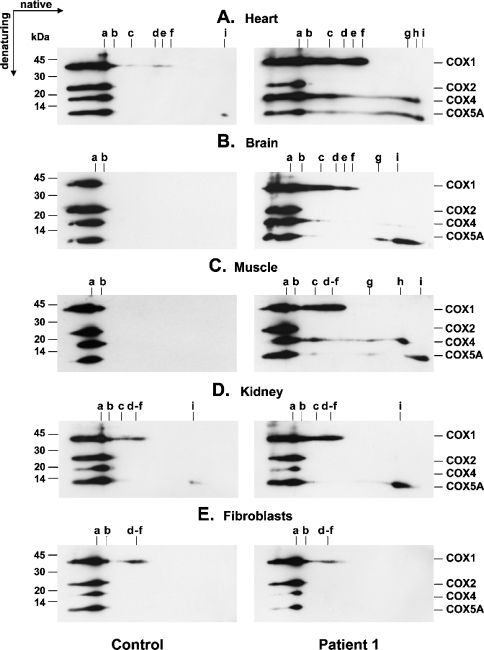
Figure 3. Subunit composition of COX subcomplexes in various tissues of the SCO2 patient P1.
Mitochondrial fractions (10–50 μg) from various tissues of SCO2 patient P1 and control samples were resolved using two-dimensional BN/SDS/PAGE, electroblotted on to PVDF membranes and probed simultaneously with monoclonal antibodies specific for subunits COX1, COX2, COX4 and COX5A. Sample loads and exposures of films to the blots were chosen such that the signals corresponding to holoenzyme complex a were of similar intensities within both control and patient immunoblots. Immunoreactive material was visualized by chemiluminescence. The polyacrylamide gradient used in the first dimension (BN) was 8–16% for (A, B) and 10–18% for (C–E). The positions of COX holoenzyme (a) and COX subcomplexes (b–i) and the migration of molecular-mass standards (kDa) are indicated.

