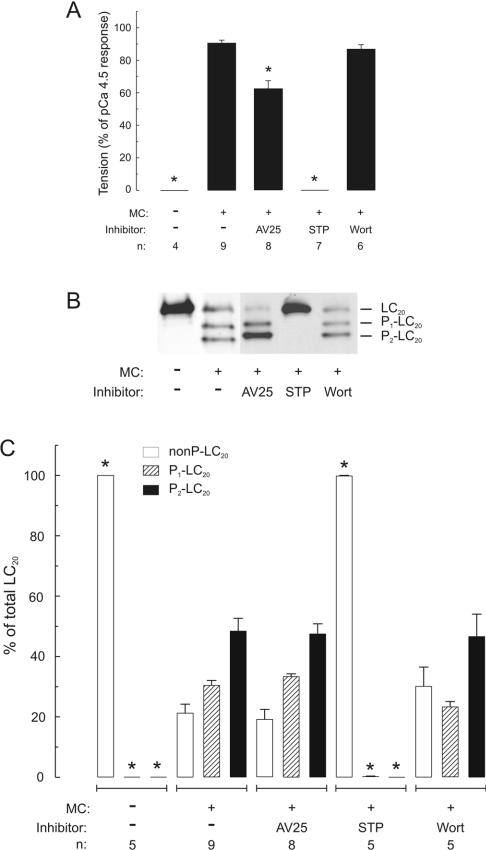
Figure 7. Effect of AV25 on contraction and LC20 mono- and di-phosphorylation in Triton-skinned rat caudal arterial smooth muscle containing contractile calmodulin.
(A) Steady-state force developed in Triton-skinned strips at pCa 9 in the absence or presence of microcystin (MC; 1 μM). Where indicated, tissues were incubated with AV25 (100 μM), staurosporine (STP; 5 μM) or wortmannin (Wort; 10 μM) for 10 min prior to addition of microcystin. (B) Once steady-state force was attained, tissues were quick-frozen for analysis of LC20 phosphorylation by urea/glycerol-PAGE, which separates unphosphorylated, mono- and di-phosphorylated forms of LC20. (C) LC20 bands were quantified by scanning densitometry of gels such as are shown in (B). Different exposure times were used for quantification of these data to ensure that signals lay within the linear range of the relationship between protein amount and signal intensity in each case. Results are expressed as percentages of total LC20 for unphosphorylated (nonP-LC20; open bars), monophosphorylated (P1-LC20; hatched bars) and diphosphorylated (P2-LC20; black bars) bands. Phosphorylation stoichiometry was calculated from the following equation: mol of Pi/mol of LC20=(y+2z)/(x+y+z), where x, y and z are the signal intensities of unphosphorylated, mono- and di-phosphorylated LC20 bands respectively. The following phosphorylation stoichiometries were determined: 1.26±0.07 mol of Pi/mol of LC20 (MC alone), 1.28±0.07 mol of Pi/mol of LC20 (MC+AV25) and 1.16±0.14 mol of Pi/mol of LC20 (MC+Wort). n values are indicated below each histogram. Asterisks indicate P<0.001 compared with values at pCa 9 in the presence of microcystin; in all other cases, P>0.3.

