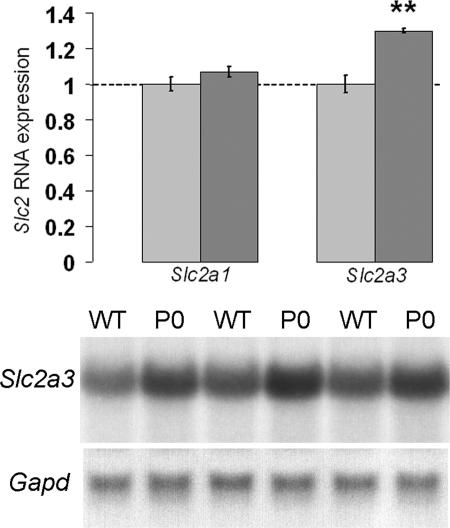
Fig. 2.
Expression analysis of the glucose transporters Slc2a1 and Slc2a3 by Northern blotting in Igf2 P0+/- placentas at E16. Graphs of the mean expression levels are shown with the wild-type levels normalized to 1, together with representative Slc2a3 Northern blots of total RNA obtained from wild-type (WT) and Igf2 P0+/- placentas (P0). Bars indicate SE. WT+/+, n = 12; P0+/-, n = 12 for Slc2a3; n = 7 for both groups for Slc2a1. **, P < 0.01.

