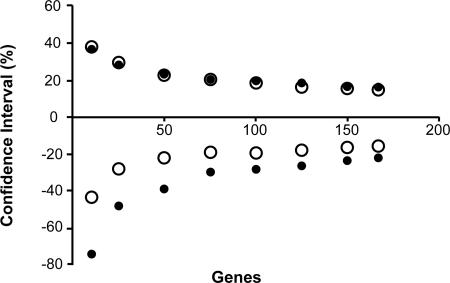
Fig. 4.
The relationship of the lower and upper limits of the 95% C.I.s (as a percentage of the estimated time) with the number of genes analyzed by using the ML-distance approach (filled circles) and the Bayesian analysis (open circles). Each point is an average based on computed C.I.s of 10 random subsets of genes. The dashed line illustrates the trend of the Bayesian interval. Similar results were obtained by using the data generated by computer simulation based on the evolutionary parameters of the third positions in different genes.

