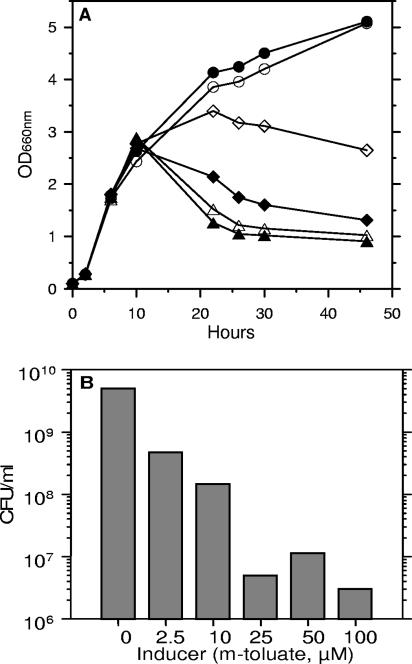
FIG. 6.
The effect of the level of the inducer concentration on growth and cell viability of Pf201Δ algCΔalgL::TnKB60. (A) Growth (OD660). Uninduced, ○; 2.5 μM, •; 10 μM, ⋄; 25 μM, ⧫; 50 μM, ▵; 100 μM, ▴. (B) CFU/ml after 30 h of growth. Cells were grown in shake flasks. The experiment was carried out two times with similar results, and one of these experiments is shown in the graph. CFU values were determined as described in the legend to Fig. 5.

