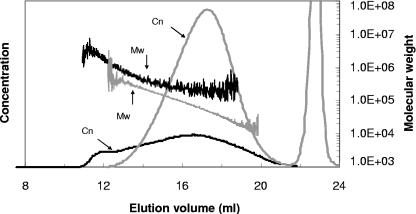
FIG. 7.
Molecular mass distributions of alginates from Pf201 (gray) and Pf201ΔalgCΔalgL::TnKB60 (black) by SEC-MALLS. Cn, concentration signals (refractive index detector response [arbitrary units]); Mw, molecular mass calibration curves (calculated on-line from light scattering). The molecular mass corresponding to a point on the concentration curve is given by the intersection of a vertical projection from the concentration signals to the molecular mass calibration curves (molecular mass axis). The noise occurring at high elution volumes is due to weak scattering signals. The calibration curves (molecular mass curves) are shifted along the volume axis to different degrees due to dependence of the elution profile on the sample concentration. The peak at 23.5 ml represents the salt peak. The cells used for production of the alginates were grown in shake flasks.

