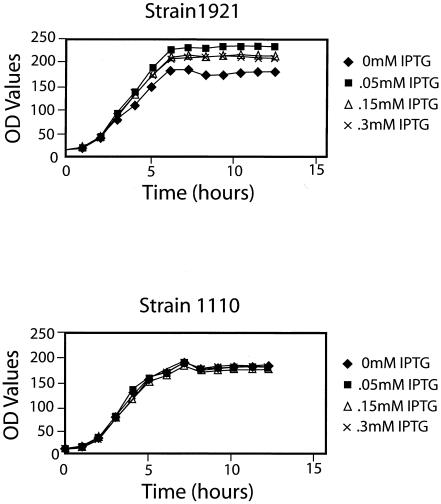
FIG. 2.
Optical density profiles of E. coli cultures containing different levels of Hda protein. A Klett colorimeter (green filter) was used to collect optical density (OD values) profiles of the indicated cultures grown and induced with IPTG as described in the Fig. 1 legend. The slightly reduced optical density profile of strain 1921 without IPTG was not representative of additional experiments.

