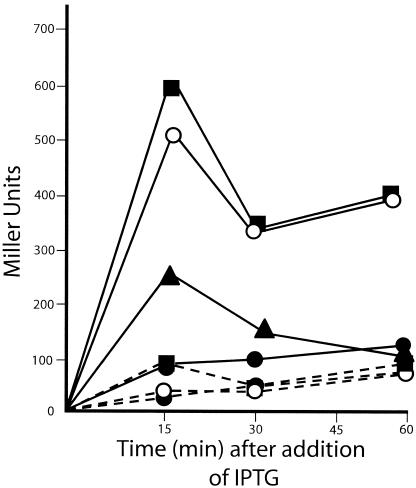
FIG. 3.
Induction of the SOS Response by Hda overexpression. Strains 1922 (pSE200, pPK101) and 1923 (pSE200, pET17B) were grown until mid-logarithmic phase and induced (or not) with 0.5 mM or 1.0 mM IPTG. β-galactosidase activity was measured in Miller units as described by Maniatis et al. (12). As a positive control of the SOS response, mitomycin-C was added at a final concentration of 100 μg/ml to a culture of strain 1922 2 h prior to assay (14). All points represent an average of three separate experiments. Solid line, strain 1922; dashed line, strain 1923; •, no induction; ○, 0.5 mM IPTG; ▪, 1.0 mM IPTG; ▴, 100 μg/ml mitomycin-C.

