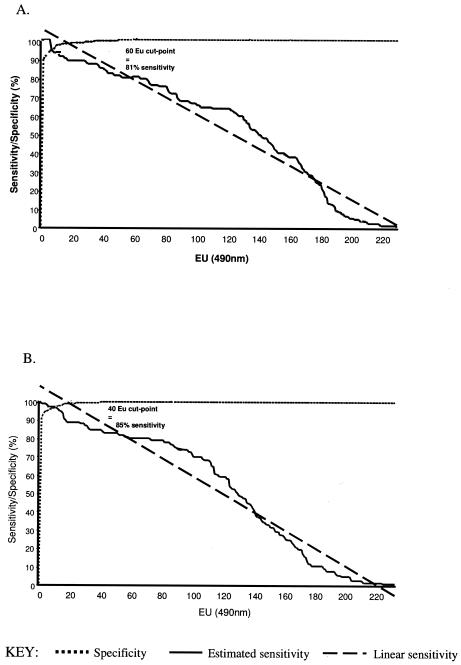
FIG. 1.
ROC curve analysis of IgG1 ELISA. Estimated sensitivity and specificity values using complex M. paratuberculosis protein antigens. Serum samples from 102 deer with confirmed M. paratuberculosis infection, as well as 508 samples obtained from deer herds with no prior history of JD, were assayed by IgG1 ELISA using PPDj (A) or PpAg (B) as the target antigen. Data were entered into a ROC analysis program; numerals refer to the calculated ELISA cut points and estimated test sensitivity values corresponding to 100% estimated test specificity for each antigen.

