
Fig. 5.
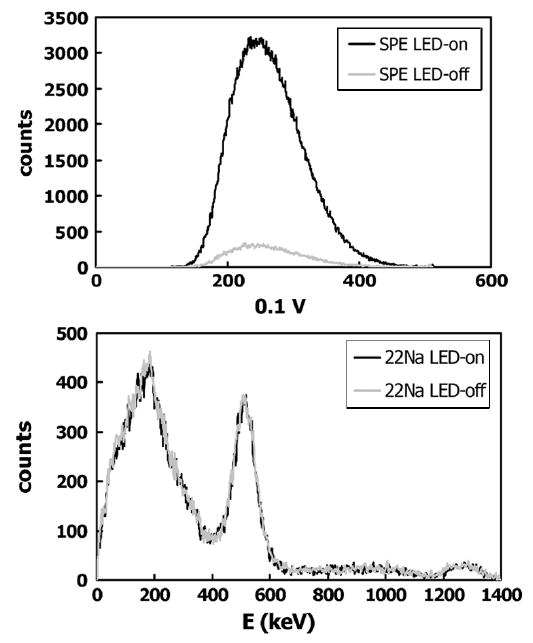
Top panel shows the single photoelectron peak (SPE) obtained on one channel of a digitizer due to the red LED light source (dark curve). The gray curve is the result for this channel when the light source is turned off. The bottom panel shows a simultaneously acquired energy spectrum in the second channel of the digitizer due to γ rays from a 5 μCi 22Na source.