
Fig. 2.
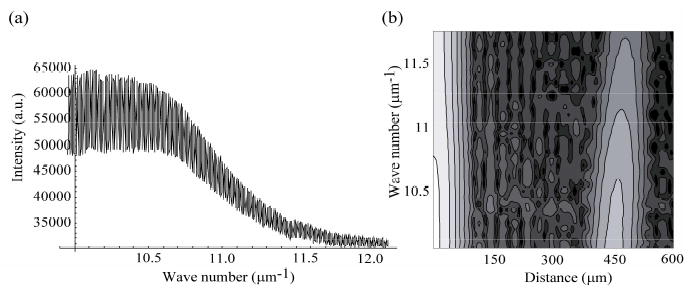
(a). Typical spectrum of light scattered by the in vitro cell sample. (b). Contour plot showing the depth resolved spectral data for the T84 cell sample.
Official websites use .gov
A
.gov website belongs to an official
government organization in the United States.
Secure .gov websites use HTTPS
A lock (
) or https:// means you've safely
connected to the .gov website. Share sensitive
information only on official, secure websites.
(a). Typical spectrum of light scattered by the in vitro cell sample. (b). Contour plot showing the depth resolved spectral data for the T84 cell sample.